War with Iran and U.S. Diesel Risk
OCT is evaluating how a potential war with Iran could reshape U.S. diesel prices and transportation costs in 2026. The analysis connects conflict scenarios in the Middle East with global oil markets, domestic diesel prices, and the cost structure facing carriers and shippers that rely on the Port of Oakland.
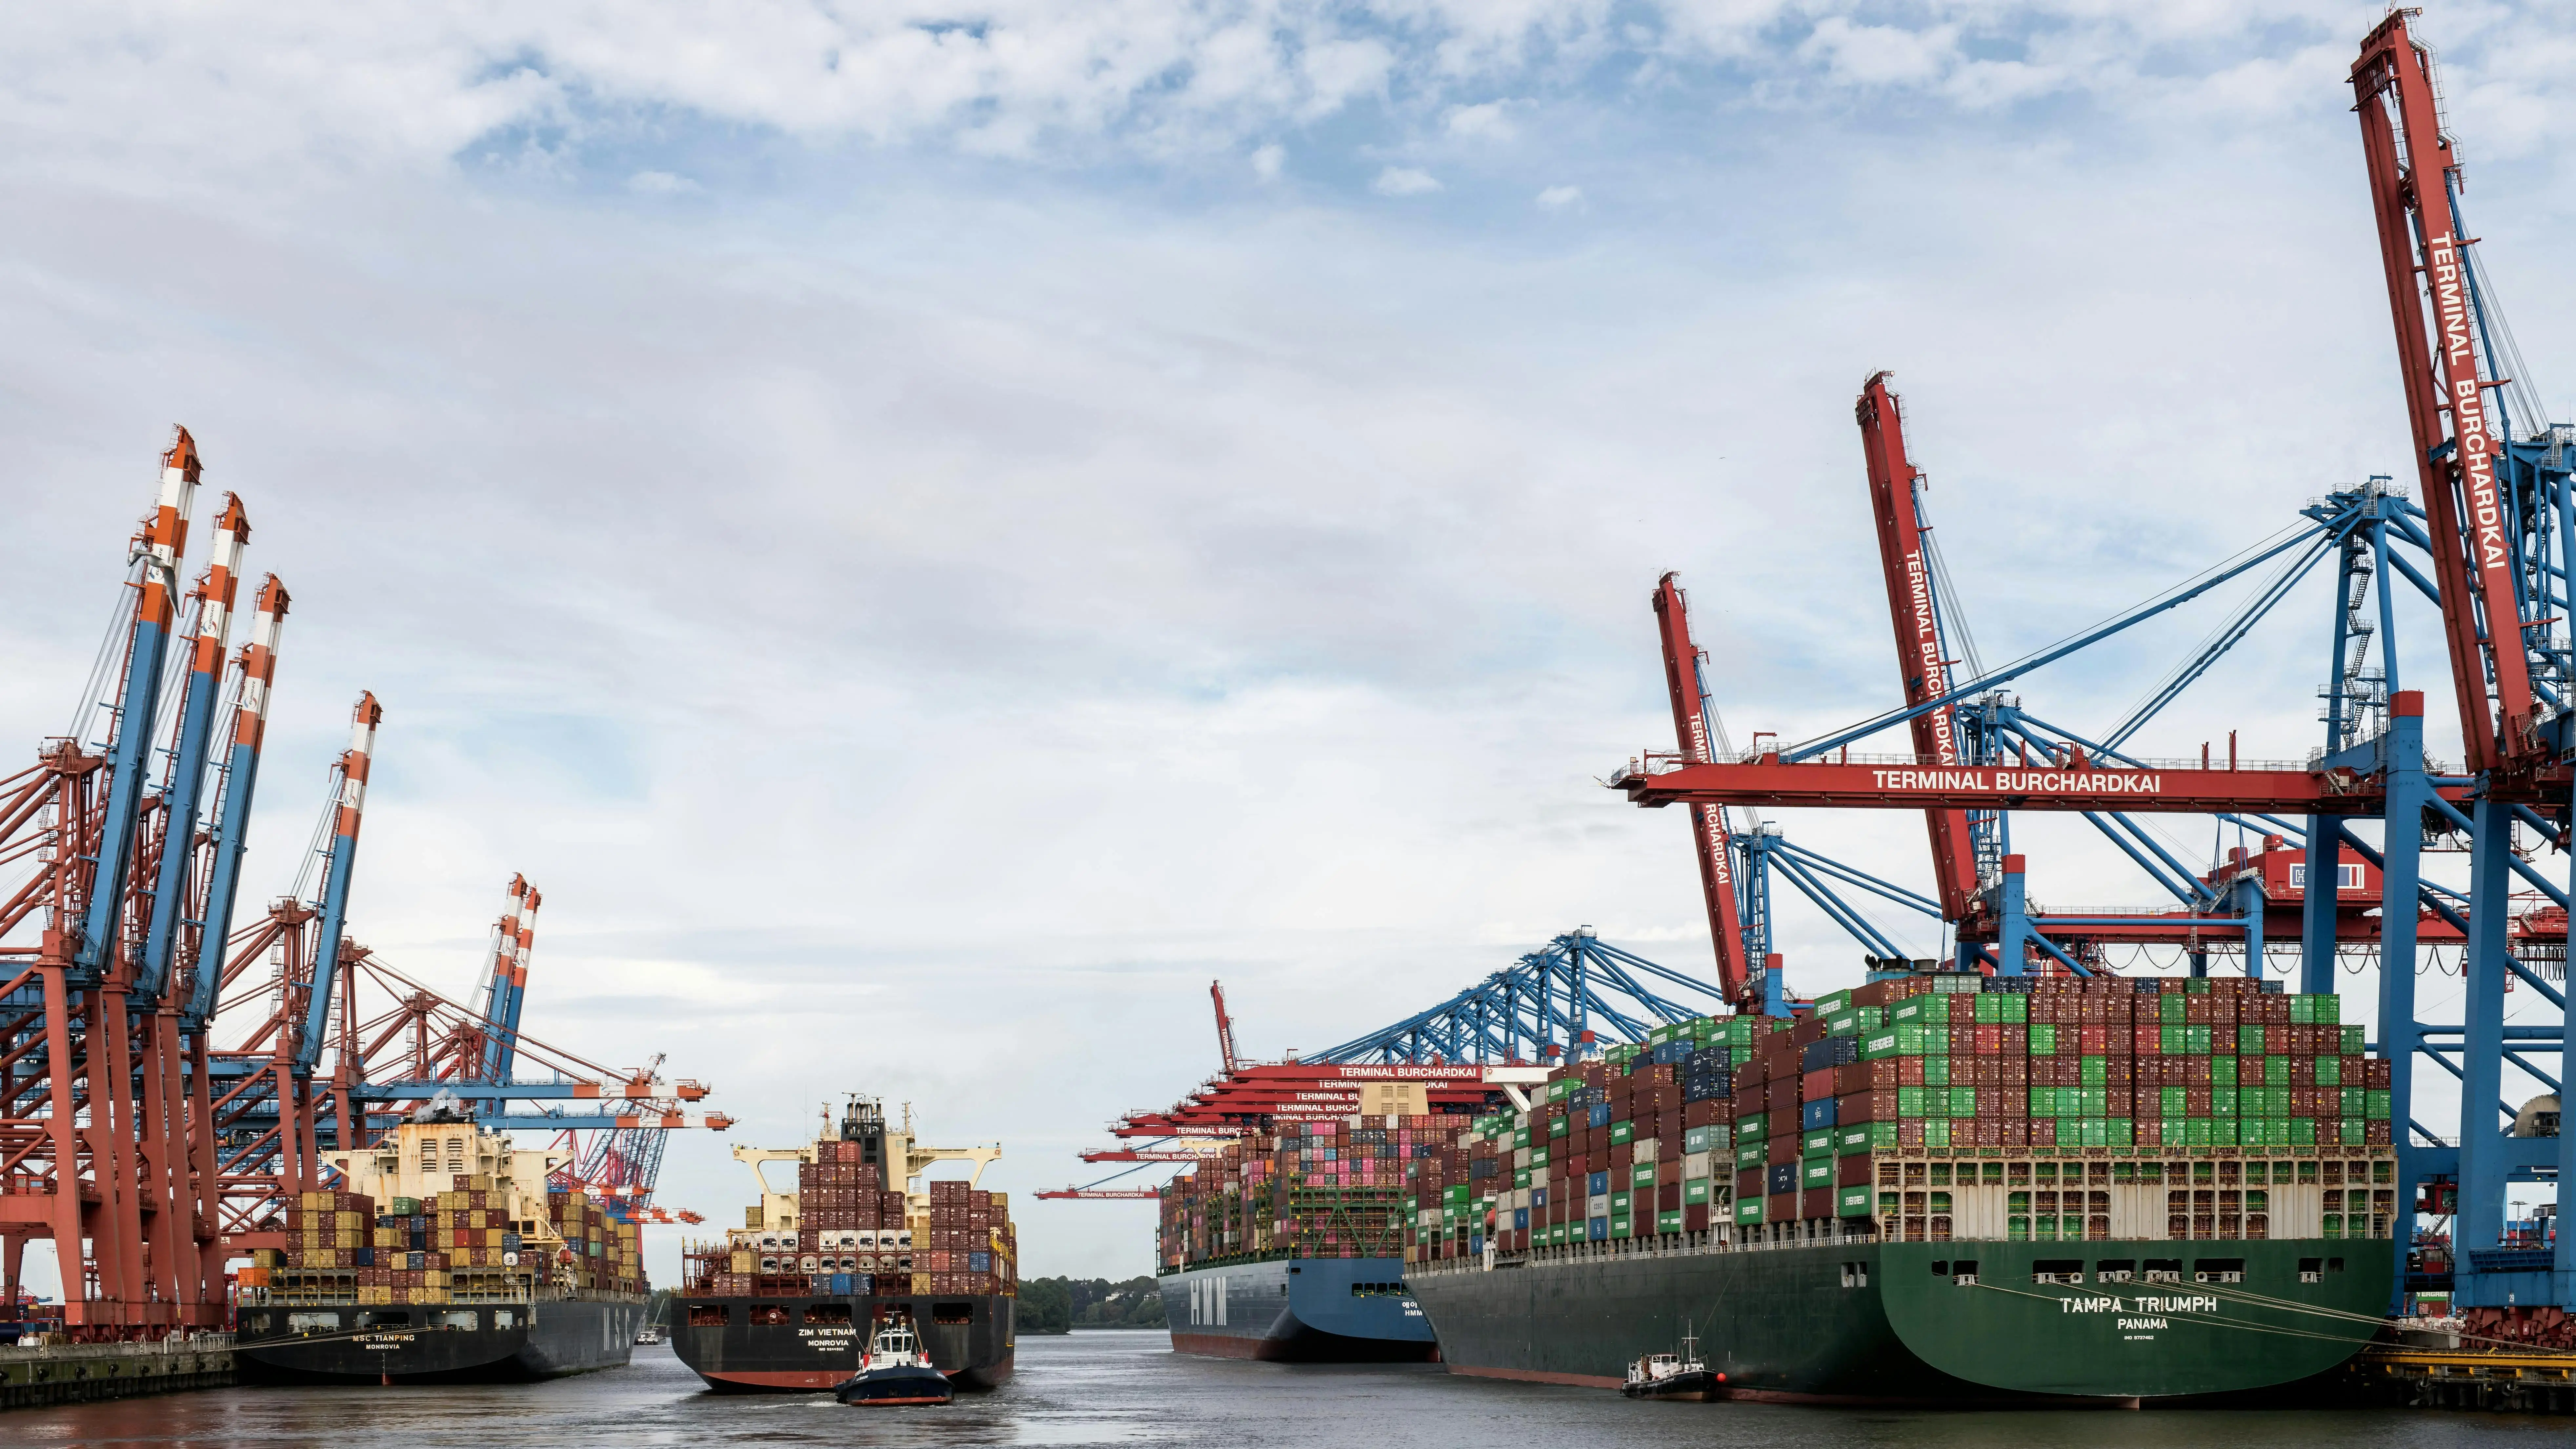
At the center of this assessment is the Strait of Hormuz, a critical energy chokepoint that carries roughly 20 percent of global oil supply. Any conflict‑driven disruption in this corridor feeds directly into the diesel outlook for the year.
Global Oil Market Connection and Strait of Hormuz
The global oil market framework highlights several points:
-
Conflict escalation involving Iran increases uncertainty
-
The Middle East controls a major share of exports
-
Tensions that threaten shipping typically push crude prices higher
Within this context, the Strait of Hormuz is treated as a critical energy chokepoint. About one fifth of global oil supply passes through this narrow passage. Its importance means that partial or prolonged closure quickly becomes a central driver in diesel price scenarios for 2026.
U.S. Diesel Price Forecasts for 2026
OCT’s diesel outlook is organized around four main scenarios, each with its own crude and diesel price ranges, timeline, and probability. The baseline national diesel average for 2025 is 3.66 dollars per gallon, which serves as a reference point.
Scenario Table
| Scenario | Crude (Brent) | U.S. Diesel (Nat’l Avg) | Timeline | Probability summary |
|---|---|---|---|---|
| Quick de‑escalation | 73–78 dollars/bbl | 3.90–4.05 dollars/gal | 1–2 weeks | Strait reopens via negotiation, prices normalize by mid‑April |
| Extended campaign (4–5 wks) | 80–95 dollars/bbl | 4.10–4.50 dollars/gal | 2–6 weeks | Conflict continues under escort, sustained elevation through Q2 |
| Hormuz prolonged closure | 95–120 dollars/bbl | 4.50–5.25 dollars/gal | 3–10 weeks | Commercial traffic halted, Gulf infrastructure damaged, diesel approaches 2022 crisis levels |
| Full regional war | 120–150+ dollars/bbl | 5.25–6.50+ dollars/gal | Months | Saudi/UAE production hit, global recession trigger, diesel exceeds June 2022 record of 5.81 dollars/gal |
Note: All crude and diesel price ranges, timelines, and probability summaries are forecasts and are subject to change.
Impact of Higher Diesel on Transportation Costs
Higher diesel is identified as a direct driver of logistics expenses. Across the trucking sector, diesel is roughly 20 to 30 percent of operating costs. As prices rise along the scenario paths, that share leads to substantial pressure on freight rates.
Key implications include:
-
Trucking: fuel surcharges (FSC) are applied, increasing freight rates
-
Ocean freight: higher crude raises marine bunker fuel, which is recovered via bunker adjustment factors (BAF) added to rates
-
Rail and barge: similar surcharge systems tied to fuel indexes push up costs
For the most severe diesel scenarios, the analysis estimates that total transportation costs for shippers could rise by approximately 20 to 30 percent.
Note: All operating cost shares and transportation cost impact ranges are estimates and are subject to change.
U.S. Diesel Prices Already Moving Higher
U.S. diesel prices jumped 8.8 cents to 3.89 dollars per gallon in the week ending March 2, 2026, the steepest weekly increase since the 2022 energy crisis. With crude oil up 8–12 percent and the Strait of Hormuz effectively closed to commercial traffic, diesel is projected to reach 4.15–4.50 dollars per gallon within 2–4 weeks under current conflict conditions.
For a typical long‑haul trucking operation, this move translates to approximately 0.04–0.10 dollars in additional cost per mile, or 2,500–6,500 dollars in additional annual fuel cost per truck. Ocean carriers have already announced emergency surcharges of 3,000 dollars per FEU in response to these conditions.
Total U.S. transportation cost inflation tied to the Iran conflict is estimated in the 5–15 percent range across modes, depending on how long the disruption lasts.
Note: Price levels, per‑mile impacts, surcharge amounts, and transportation cost inflation ranges are estimates based on current conflict conditions and are subject to change.
Diesel: The Supply Chain’s Lifeblood
Diesel is widely considered the lifeblood of the supply chain, powering the movement of goods across trucks, ships, rail, and distribution networks. Virtually every product consumed in the U.S. relies on diesel at some stage, linking production to final delivery.
When diesel prices rise, the effects ripple across the entire system. Higher fuel costs increase the expense of transporting raw materials, intermediate goods, and finished products, putting upward pressure on prices throughout the economy.
This dynamic is part of a well-documented inflation transmission mechanism. According to research from the Federal Reserve Bank of St. Louis, a sustained 10% increase in diesel prices typically leads to a 0.1–0.3% rise in core CPI within six months, highlighting how fuel costs directly influence broader inflation.
Mechanism of Cost Transmission
OCT outlines a step‑by‑step mechanism for how diesel price increases transmit through the supply chain:
-
Diesel costs rise across fleets.
-
Fuel surcharges are passed from carriers to shippers.
-
Transportation fees increase as surcharges and base rates adjust.
-
Higher transportation costs ultimately contribute to higher retail prices.
This path explains why fuel shocks can take several months to show up fully in consumer prices.
Diesel‑to‑CPI Impact
Research from the Federal Reserve Bank of St. Louis indicates that a sustained 10 percent increase in diesel prices typically adds about 0.1–0.3 percentage points to core CPI within six months. This relationship is based on specific research outcomes that track how fuel costs feed into broader price changes.
Note: Diesel‑to‑CPI impact ranges are research‑based estimates and are subject to change.
Forecast Inflation Impact in 2026
Looking ahead to 2026, OCT frames a conflict‑driven diesel rise of 15–30 percent against an initial CPI level of roughly 2.4 percent in January 2026 and a 2.0 percent target. Under those conditions, the forecast impact on headline inflation is an additional 0.2–0.5 percentage points, enough to push CPI above the Federal Reserve’s target if fuel pressures persist.
Note: CPI starting values, diesel rise assumptions, and the 0.2–0.5 percentage point inflation range are scenario forecasts and are subject to change.
Federal Reserve Policy Implications
These inflation effects have direct implications for interest rate policy:
-
Higher inflation makes potential rate cuts riskier
-
An anticipated cut may be removed from the policy pathway
-
The Federal Reserve may maintain policy restraint, keeping rates higher for longer
This policy backdrop becomes part of the environment OCT customers operate in as they plan trucking, transloading, and warehousing decisions around the Port of Oakland.
Note: Policy implications are scenario‑based and may change as economic conditions evolve.
OCT Special Services for Complex Freight
While monitoring these macro risks, OCT continues to support complex freight at the Port of Oakland with a set of specialized services.
Heavy Machinery Transloading
OCT handles heavy machinery transloading for large equipment moving between vessel, rail, and truck. The focus is on safe lifting, staging, and securement.
Note: Heavy machinery handling processes, equipment availability, and timelines are subject to change.
Container Insulation and OOG Crates
Container insulation services and OOG crate transloading support temperature‑sensitive and out‑of‑gauge cargo. Procedures are tailored to maintain integrity and fit within dimensional limits.
Note: Container insulation and OOG crate handling methods, capacity, and service options are subject to change.
Coils, Reels, HazMat/OOG Drayage, Specialty Cargo
OCT also offers:
-
Coils and reels transloading for industrial freight
-
HazMat and OOG drayage for regulated and oversized loads
-
Specialty cargo handling for project freight outside standard container shapes
Note: Coils, reels, HazMat/OOG drayage, and specialty cargo capabilities are subject to change.
Core OCT Services: Drayage, Transloading, Warehousing
OCT’s core platform at the Port of Oakland connects ocean services to inland destinations.
Drayage
Drayage services include:
-
Rentals, prepull, ISO tank, and HazMat loads
-
Permits and specialized chassis for overweight containers
-
HazMat and OOG drayage capability
-
General freight and import/export containers
-
Tri‑axle support for heavy loads
-
Reefer container handling
-
Long haul lanes to WA, OR, UT, NV, AZ, and ID
Note: Drayage features, routes, and equipment availability are subject to change.
Transloading
Transloading services support flexible cargo flows:
-
Transloading of palletized cargo
-
Handling of non palletized freight
-
Stripping and reloading of containers
-
Cross‑dock operations and short‑term storage
-
OOG transloading and project freight handling
-
Export and import loading tailored to cargo profiles
Note: Transloading services, commodities handled, and operating details are subject to change.
Warehousing
OCT’s warehousing near the Port of Oakland provides:
-
35,000 square feet of secure space
-
Racked and floor storage options
-
Capacity for palletized, crated, and oversized cargo
-
Short‑term and long‑term storage programs
-
Fenced and secured facilities with surveillance
Note: Warehouse size, features, and storage terms are subject to change.
Fast Drayage Quotes with Drayage Calculator 2.0
To keep pricing responsive in a volatile fuel environment, OCT offers the Drayage Calculator 2.0. Shippers can enter shipment details and receive a drayage rate in less than 20 seconds, delivered by email.
Note: Drayage Calculator 2.0 features, response times, and pricing outputs are subject to change.
Port of Oakland Vessel Schedule and OCT Gate Hours

 .
.
Note: Vessel names, receiving windows, cutoffs, arrival times, and gate hours are all subject to change without notice.
Plan Your Fuel‑Aware Oakland Moves with OCT
With conflict‑driven diesel scenarios, inflation risk ranges, and policy considerations clearly laid out alongside specialized services, core drayage and transloading, rapid quoting, and vessel schedules, OCT provides Port of Oakland shippers with a structured way to prepare for 2026.
Shippers moving containers, heavy machinery, coils, reels, HazMat, OOG, or other specialty freight through Oakland can partner with OCT to keep operations aligned with fuel realities and macro conditions in the year ahead.

What Is Container Drayage? How It Works in Oakland Logistics
.png)
Container Drayage in Oakland: Complete Guide for Importers & Brokers